Be sure to read "What Perfect Tests Should Look Like" before viewing these.
These images are waveform and spectral examples to show how phone transmissions work. Your "scopes" (graphs) are your friend. Learn how to properly use them and it will be hard to not produce good sounding results.
These pictures are generally too big to show in line, so view each one as you read each section.
Limitations: Some will try and squeal that my sound card and speakers aren't good enough for these test and neither is my voice modem (directly plugged into the phone line). Some will also yelp at one phone line recording another. My sound card and speakers are so much better than anything telephone that this is a moot point. Some will say that cell can't compete with wireless and wireless can't compete with land line. I ask, why not? I also had 2 phone lines at the time where I personally put in fresh CAT5 wiring and undid all the moron CAT3 wiring of the previous owners and phone company. When I got my second phone line, the phone company buried new cabling for both lines to the pedistal in my back yard. In short, these tests were done with better than average conditions. These tests are not intended to replace complex lab tests but to replicate general everyday conditions.
These recordings were made with the speaker volume at about an average level someone would be talking (close to 80db).
As some may have guess by now, similar methods are used for testing speakers and microphones. Oddly, phone equipment is just that.
Oh yeah, found this in the Asterisk PBX manual. No wonder phones sound so bad...
"Aoccdrnig to rsereach at an Elingsh uinervtisy, it deosn’t mttaer in waht oredr the ltteers in a wrod are, the olny iprmoetnt tihng is taht frist and lsat ltteres are in the rghit pclae. The rset can be a toatl mses and you can sitll raed it wouthit a porbelm. Tihs is bcuseae we do not raed ervey lteter by istlef, but the wrod as a wlohe." (The source of this quote is unknown - see http://www.bisso.com/ujg_archives/000228.html.) Tihs is ture with snoud, too.
White noise waveform. While the perfect view of the graph does bounce around a little, the playback amplitude is constant and the apparent sound is constant. These should not be fluctuating in the recording. This test is also good for showing how loud the phone microphone is. A proper loudness setting would have the waveform nearly fill the graph.
White noise spectral view. Ideally this will look like a consistently smashed pizza for all frequencies. Realistically, this will fade in at the bottom low frequencies (typically 50-200Hz) and gradually fade out at the top high frequencies (typically 3400Hz or so). Problem frequency areas will show up as either brighter or darker bands depending on the issue.
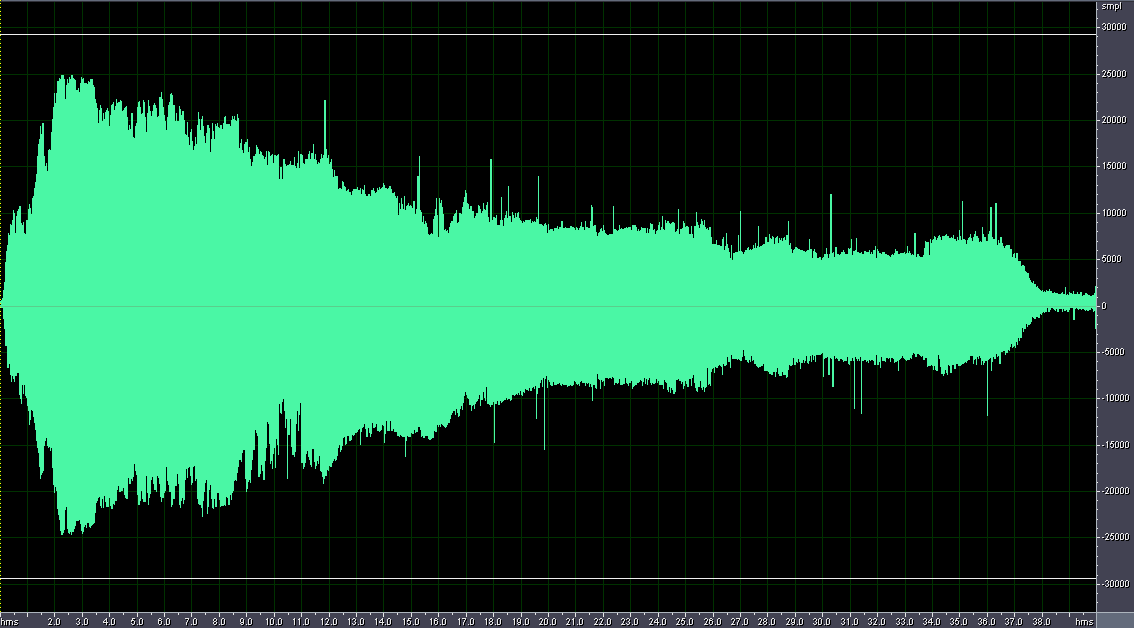
Frequency sweep waveform from low to high. Under ideal circumstances, this should ramp in quickly, remain a flat block, then ramp out quickly at the very end. Any drop lower or raise higher in amplitude indicates trouble at that frequency. Zooming in close up should show a perfect sine wave for these tests. Any deviation from that can be considered signal distortion.
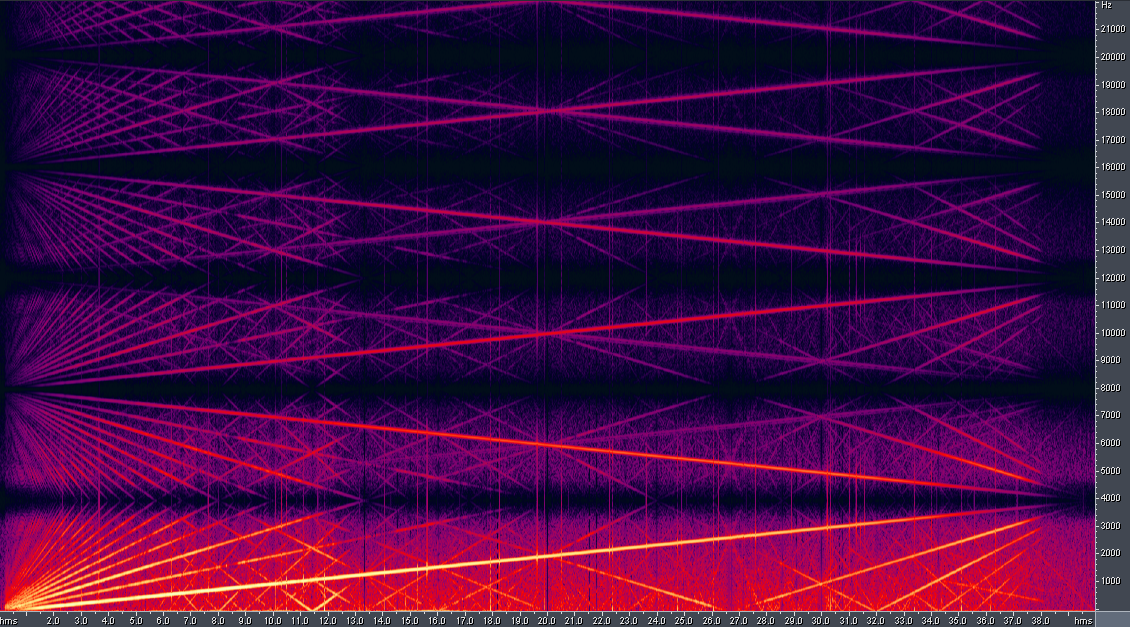
Frequency sweep spectral view from low to high. Ideally this will look like a consistent and solid diagonal line with absolutely nothing on either side. In reality there seems to be an awful lot of lesser criss crossing and parallel lines showing harmonic distortion. Some phones seem to be worse than others with cell phones being the worst.
Wireless Black Handset: White noise waveform. While white noise does jump around a little, this should not be pulsating up and down. Overall volume of the microphone is reasonably good, though.
Wireless Black Handset: White noise spectral view. The responsive frequency range is about 140Hz to 3300Hz where it fully fades out at 3600Hz. Notice the problem area at 2600Hz where the signal drops off. Also notice that there are 3 brighter "humps" in the graph where the signal is stronger.
Wireless Black Handset: Sweep waveform. This graph shows 3 main trouble areas in the bigger dips. Lesser trouble areas are between the more narrow peaks.
Wireless Black Handset: Sweep spectral view. The trouble areas are more difficult to see in the diagonal line intensity. What shows up surprisingly clear are all the resonant distortion harmonic lines in the criss cross patterns.
Nokia 6010: White noise waveform. The overall volume is inconsistent and lower than it should be.
Nokia 6010: White noise spectral view. The responsive frequency range is about 60Hz to 3600Hz where it fully fades out at 3800Hz. This is a better response range than most. Notice the slump bands at 600Hz, 1600Hz, and 2600Hz.
Nokia 6010: Sweep waveform. This graph shows 3 main trouble areas in the bigger dips with the entire rest of the waveform being lesser trouble areas. This graph should ideally be a flat block. No wonder I have so much trouble having a cell phone conversation. ("Can you hear me now?", "Yes, but I haven't a clue what you just mumbled.")
Nokia 6010: Sweep spectral view. The criss crossing and parallel resonant distortion lines are clear. The vertical parallel resonance patterns that occur in many short bursts seem to be unique to cell phones. Both phones and headsets display it in other tests. Once again, no wonder I have so much trouble having a cell phone conversation (especially cell to cell).
200Hz Waveform Close Up. This should be a pure 200Hz sine wave. The malformed peaks are obviously clear in this example. The sides are also bent somewhat but the peaks are easier to see. Each malformed peak contributes to loss of clarity during the call.
Audio_Sweep4k_HeadSet-BlueTooth-PlantronicsM2500.png
Audio_Sweep4k_HeadSet-BlueTooth-PlantronicsM2500_Wave.png